When it comes to Power BI vs Tableau, there is one common query that crops up in all the data analytics forums, career consultations, and office discussions in 2026. It is whether Power BI is easier than Tableau. Power BI vs Tableau is not simply a choice between the two – it is a choice that affects your ability to learn, your chance of landing an interview, and your effectiveness in the job itself.
Tableau and Power BI are both titans of data visualisation. While Tableau is well-known for its elegant visuals and presentation prowess, Microsoft Power BI has made great strides by virtue of its tight integration with the Microsoft suite. Not being able to decide between the two can be a difficult task, particularly if you’re just entering the field.
The purpose of this blog post is to make the Microsoft Power BI vs Tableau decision easy by comparing and contrasting them in every conceivable way. This will give you a definitive answer to help choose the better one for you.
What Are Power BI and Tableau?
Microsoft Power BI
Microsoft Power BI is a cloud-based platform for business intelligence provided by Microsoft. The product can access a large number of sources, create interactive reports, and allow sharing throughout an organisation. Launched in 2014, it has gained enormous popularity and become one of the leading business intelligence solutions in the world.
Tableau
Founded in 2003 and bought out by Salesforce in 2019, Tableau is a data visualisation software that is famous for its drag-and-drop interface and remarkable capacity in dealing with complicated datasets. Frequently used for data science, marketing analysis, and business reporting, the software’s principle is focused on intuitive and graphical data exploration.
Both of these products were ranked among the leaders in Gartner’s Magic Quadrant for Analytics and BI Platforms for years. However, the key issue is not which product is objectively better – the main thing is which one is better for you.
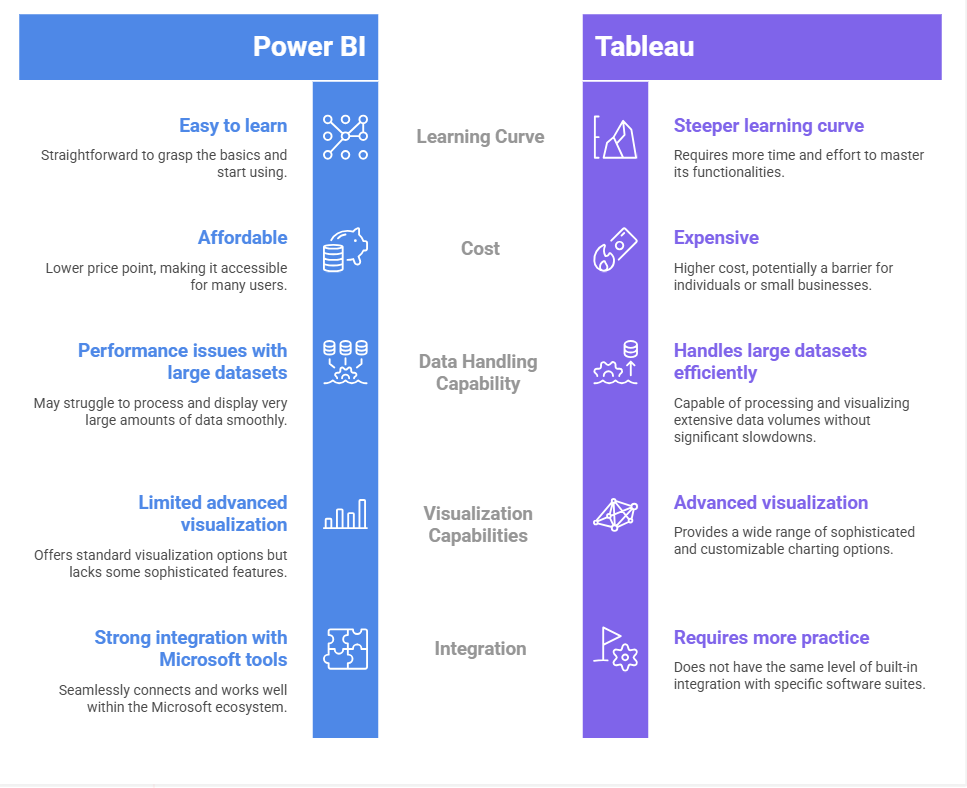
Power BI vs Tableau: Key Differences
1. Learning Curve: Which Is Easier to Learn?
Power BI — Easier for Beginners in the Microsoft Ecosystem
For those who are already working with Excel, using Power BI will become quite easy to do. The way Microsoft has developed Power BI is such that the experience becomes like working on Excel itself: familiar ribbons, dragging and dropping fields, and a look-alike layout compared to Excel pivot tables and Power Query.
The language used in Power BI to create measures and calculated columns is DAX (Data Analysis Expressions). Although this may become complicated in some situations, basic reports and dashboards can be created even without writing any code.
Tableau – Easier for Visual Thinkers and Data Explorers
While Tableau’s Learning curve seems difficult at the beginning due to the lack of analytics skills, it soon gets easy when one understands how to use dimensions and measures. Tableau provides a feature called “Show Me,” which automatically selects the best chart type to be used depending on the selected data.
Tableau has its own Calculated Field language, which is regarded as being more friendly and easier to understand than DAX. For complicated calculations, Tableau utilises the VizQL engine, which is powerful and user-friendly.
| Quick Verdict: Power BI is easy to learn for those who have experience using Excel or other Microsoft products. Tableau is more visual-friendly and easier to learn for visual learners. |
2. Interface and Usability
The interface of Power BI Desktop consists of the ribbon that is divided into three tabs named Report View, Data View, and Model View. All Visualisations, Fields, and Filters are properly organised, but new users may have to attend several tutorials to use all features comfortably.
The Tableau Desktop interface begins with a sheet-oriented design where Rows, Columns, Pages, and Marks shelves dictate the layout. The left-hand side contains the fields, which can be dropped into shelves to see an immediate change. This kind of interface is very appealing to visual learners who thrive on trying out different things.
In corporate settings, Power BI is favoured for its similarity to Microsoft Office. Independent analysts who work with data prefer Tableau Desktop.
3. Data Processing
Data processing in Power BI can be described as excellent since it processes structured data very well.
Tableau provides a high level of processing not only of structured but also of unstructured data.
Conclusion: Power BI is easy to use for beginners, while Tableau is complicated.
4. Visualisation Features
Furthermore, Tableau has outstanding visualisation features. Excel allows for a lot of Data Visualization, which helps create very engaging dashboards.
Even if Power BI provides very nice visuals, it’s not as flexible as Tableau.
Final note: Tableau, for visualisation, is better than Power BI but time-consuming.
5. Comparison of Costs: A Learning Hindrance?
The cost for one person is more significant in assessing whether it is easy to learn.
Power BI -Install Desktop and Features of Power BI
You only pay for publishing and distributing reports to other people ($ 10 per month)
Tableau: There is a free Public option, also, but it forces you to put the data out there in public. That might not be so good for someone trying to keep information private for personal use. Tableau Costs start at $75 a month.
Pros and Cons- Power BI vs Tableau
If you are new to data analytics, then start with Power BI. Moreover, it will build your foundation quickly. Once you feel confident, shift to Tableau and refine your visualisations. This way, you get the best of both worlds.
Career Opportunities and Job Market: Power BI vs Tableau (2026)
Understanding the Power BI vs Tableau comparison requires digging deeper than just the software itself and looking at the real-life positions that companies are recruiting for in 2026. Even though both belong to the category of “Business Intelligence,” the job title and salary scale can be quite different depending on the level of data analysis needed.
Key Job Roles: What Do You Actually Do All Day?
If you scour job boards today, you will see clear patterns in how organisations are progressing in describing these roles.
1. BI Developer (Power BI Focused)
Core task — Automated reporting pipelines and enterprise-level dashboards
What do you do daily?DAX measures creation, data gateway configuration, and establishes the “Single Source of Truth” in the Microsoft Fabric environment
Important Skill: Meticulous understanding of Power Query (M) language and SQL
2. Data Visualisation Specialist (Tableau Focused)
The Core Task: Develop highly interactive, exploratory visualisations for executive decision-making
Daily Routine: Creating bespoke charts that are not available in default templates and using VizQL to unveil concealed patterns in intricate datasets.
Skill / Ability: Grounding in visual psychology and LOD (Level of Detail) expression
3. Analytics Consultant
Core Task: Advising companies on which tool to use and how to structure their data.
UM: Daily Routine: Hybrid work, i.e., Power BI is used to put together the backend for cost-saving, but Tableau is used for client-facing high-end presentations.
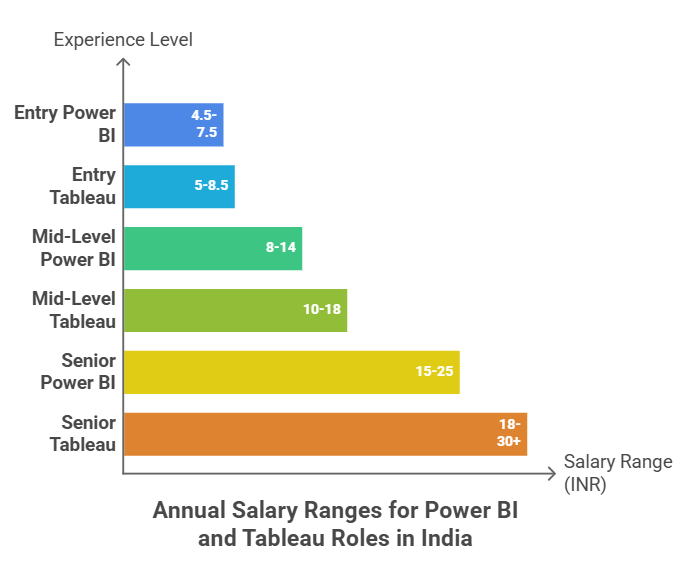
Salary Scope- Power BI vs Tableau
Learning Tips for Rapid Progress
- Study regularly with actual data sets
- Watch videos and participate actively
- Be part of online forums
- Enrol in Tableau training classes or learn Power BI
- Create projects for your portfolio
Consistency is key, not speed.
Role of Training in Learning Power BI and Tableau
Joining structured programs such as Tableau training or a Tableau course makes it easier to learn.
- A good training program improves your:
- Understand core concepts faster
- Work on real-world projects
- Gain hands-on experience
- Build a strong portfolio
Likewise, a Power BI course offers structured learning paths so that we can get up to speed quickly.
Tableau Training & The Power BI Career Path
If maximising your earning potential is the goal, the strategy for 2026 is telling:
- Begin with Power BI Essentials: Familiarise yourself with the Microsoft ecosystem for a stable entry-level position.
- Become an expert with a Tableau course: After you have learned the basics of data analysis, go to high-level visualisation. The Expert Premium is on Tableau.
- Bridge the Gap: Institutes like Henry Harvin offer combined tracks where you can master both and be a unicorn candidate who can handle every project.
Upskilling with Henry Harvin: Power BI and Tableau Excellence
The choice of a good Power BI and Tableau course can play a major role in your progress and effectiveness in mastering the subject of data visualisation. One such excellent training program on Tableau that you may consider is from Henry Harvin. Professionals flock to structured learning environments, attempting to master the debate of Power BI vs Tableau. Henry Harvin education stands tall as the best in this field by providing specialised tracks between academic and practical knowledge.
Power BI Course
- Henry Harvin’s Power BI course is designed for professionals who want to learn about data orchestration in the Microsoft environment. This course covers:
- Title: Advanced DAX Formulas: More than a simple sum, mastering complex data modelling!
- Hey, Power Query!: Simplifying ETL (extract, transfer and load)
- Real-Time Metrics and Analysis: Connecting live data streams for performance in-the-moment reporting.
- Exam preparation: Microsoft PL-300 Certification requirements.
Henry Harvin Tableau Course
Tableau intends for visual storytelling has been designed in such a way that professionals who look forward to discovering the functionality of Tableau can always choose Henry Harvin’s Tableau Course that covers:
- The VizQL System: Driving Under the Hood of Tableau Drag-and-Drop
- Spatial Analysis: Understanding geography through the lens of spatial data.
- Becoming adept at Level of Detail Expressions for Working on Data at Multiple Layers.
- Dynamic Dashboard design: Building “action-driven” dashboards that allow you to drill down on the details.
Both courses provide you with an internship with a gold standard and project-based, which will boost your resume in 2026, irrespective of taking the Henry Harvin tableau Course or the Power BI course.
Why Choose Henry Harvin?
- In-depth and Industry-specific Curriculum
- High Emphasis on Practical Learning
- Industry-based Professional Trainers
- Practical and Industry-aligned Training Programs
- Internship Programs
- Advantages of the Gold Membership Program
- Versatile Methods of Learning
- Industry-Recognised Certificate Programs
- Build up a Portfolio
- Good Results in Learning
- For All Kinds of Students
- Successful Performance Proven
Final Verdict: Which Should You Choose?
There is no single winner in the Power BI vs Tableau debate — the right choice depends entirely on your context.
Why Power BI is the Right Choice for You?
Choose Power BI if:
- You are a novice in data analytics
- You have experience with Excel
- You want quick results
- You need a budget-friendly tool
- You have access to Microsoft cloud services
Power BI is the first tool and stepping stone for most professionals, before they graduate into more advanced tools.
When Should You Choose Tableau?
Choose Tableau if:
- You want advanced data visualisation
- You work with complex datasets
- You try to become an expert in data visualisation
- You are prepared to take time out and learn
If you are an analyst who prioritises storytelling and design, Tableau is the best tool for making your insights come to life.
| Pro Tip: Can’t choose between the two? Start with Power BI. It’s free, well-integrated with other software you might be using right now, and has the highest job demand in almost any market. Mastering Power BI will make learning Tableau much simpler. |
Conclusion
There isn’t a universal answer to whether one should go with Power BI versus Tableau. Still, there is one absolute certainty regarding any of these courses: by taking either of these, you will boost your career as an analyst by leaps and bounds.
Power BI makes it easier to break into the field, costs less, and enjoys widespread adoption in businesses – all factors that make Power BI an obvious choice for almost everyone. On the other hand, Tableau is simply irreplaceable when it comes to visualisations and data handling within native data companies.
It doesn’t matter if you take part in a Tableau course, go through structured Tableau training or learn free Power BI on Microsoft Learn’s website, or choose between Power BI and Tableau in terms of enterprise procurement – your efforts are going to bear fruit for a very long time.
In today’s world, it is impossible to be illiterate when it comes to data analysis. It is these analysts who will guide their company, influence its strategy, and make all sorts of important decisions. Just pick a platform and go for it!
Recommended Reads
- What is Tableau, and Why Should You Use it For Data Analysis?
- The Essential Guide to Data Science: Skills, Course, and Career Opportunities
- The Future of Data Science: Opportunities and Challenges
- Top 25 Tableau Interview Questions and Answers in 2026
- Data Types In Tableau: The Most Important Attributes
FAQS
A beginner would prefer Power BI since its UI resembles that of Microsoft Excel. It has an extremely gentle learning curve as well.
No. The advanced version of Tableau training involves logical calculations, but basically, everything boils down to drag-and-drop functions. A non-programmer can still make beautiful visualisations.
Both tools enjoy high popularity at the moment. Whereas Power BI enjoys high demand in offices of corporations, Tableau is preferred by large technology firms and special data agencies.
In general, Tableau was better suited for handling huge volumes of data. However, Power BI’s introduction of a “Large Dataset” storage format has brought the two on equal footing.
Yes, Henry Harvin usually comes up with a career assistance program where you get to build your resume and undergo mock interviews.
The current version of Power BI works best with Windows systems only. If you are using a Mac, then you can create a virtual environment or use the Power BI Service. Tableau, on the other hand, offers Mac-native software.