
Understanding massive amounts of data requires sifting through endless streams of data, such as profit and loss reports, customer interactions, and behavioral analytics. Fortunately, this interface exists. This application is a business intelligence program as well as data visualization software, and it has altered the landscape of data analytics and interpretation. However, what is Tableau, and why is it so essential in data analysis? This blog will indicate its major focal points, its advantages, and its ubiquity among professionals in various sectors.
What is Tableau?
This analytics interface is compatible with desktop computers and mobile devices above all, which, most importantly, helps organizations cultivate or promote a data-driven culture.
Interestingly, through maneuvering this interface, a user can scrutinize their data to identify trends and patterns. Besides, the platform houses numerous features through which users can visualize data.
Besides its impeccable Data Analysis ability, it can be connected to any data source. The resources and tools available to data scientists and technical and non-technical users ensure that data is significantly transformed into valuable insights, worthy of data-driven decisions. Users can visualize and access data by transforming it into accessible and interactive visualizations through Tableau analytics.
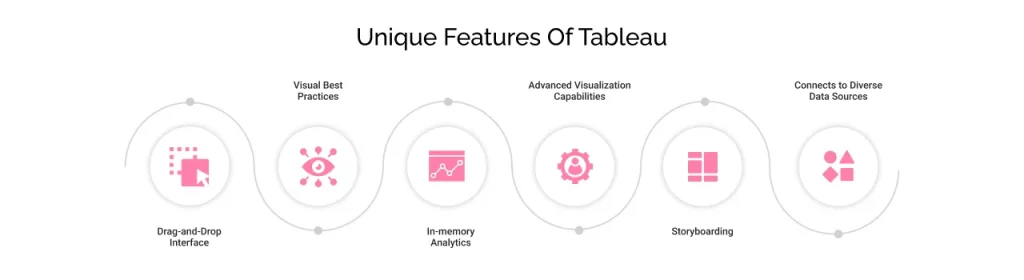
Features of Tableau
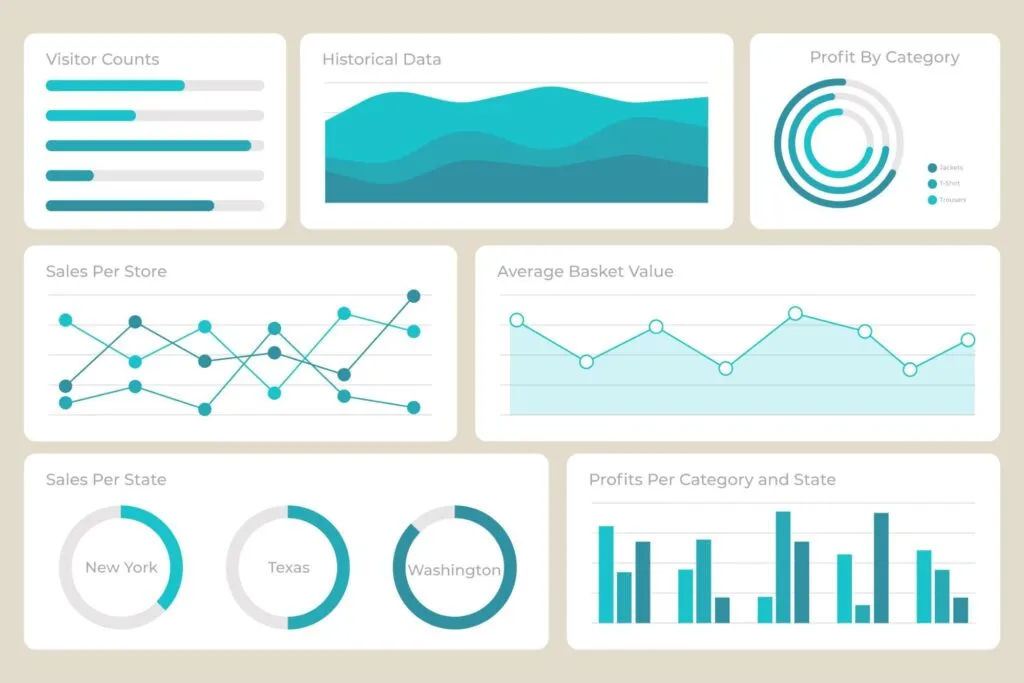
On the whole, its dashboard gives users an overall understanding of multiple datasets. Both Sheets and the dashboard are connected correspondingly, which means that any change on the sheet will automatically be updated on the dashboard.
- This feature notably saves the user from multiple navigation steps. One can access any changes in all the reports at once through the dashboard, which is fully customizable.
- Data exploration and analysis.- Enables users to visually analyze data and gain insights and explore through interactive dashboards and charts at the same time. Users can also link to various other data sources and combine, clean, and analyze data for business purposes.
- Business Intelligence Tool It is is considered one of the most prominent business intelligence tools that help organizations to make data-driven decisions through data analysis and visual reports.
Three major components are available in Tableau: desktop, public, and AI.
While its Desktop is suitable and appropriate for creating visuals and sharing, Public is a free platform where one can explore and share data visualizations online. Whereas Tableau AI features simplify and accelerate data analysis and insight generation.
Why Should You Use it for Data Analysis?
- This is specifically designed to enable data analysis for users of different skill
- levels, both technical and non-technical. It allows users to design complex visualizations and analytics without any hindrance. It harbors various data forms, providing maximum adaptability and versatility.
- In addition to the ease of accessibility, it visually communicates the stories hidden in your data sets, transforming raw figures into comprehensive charts, maps, and dashboards that are easy to share.
- Live data is accessible, irrespective of location, and the information fed is always the latest, real-time, unlike stale spreadsheets.
- Strong and moldable: This interface is versatile and works based on your needs, whether it’s for analyzing customer behavior, sales performance, or even financial trends. Besides, It can transform data from Excel sheets to extensive cloud databases.
- Ready for sharing: Findings generated through Tableau can be easily and quickly shared. Users interact with dashboards, apply filters, and drill down to the specifics without requesting additional reports.
- Encourages a proactive approach: Goes beyond showing facts and figures; it guides users in pattern recognition, spotting challenges so that more informed decisions are made and done promptly.
Career Scope after Tableau Certification
- Data Analyst. The role comprises managing available data, spotting trends, and visualizing them to aid organizational decision-making.
- Business Intelligence Analyst specializes in data extraction and analysis to enhance business strategy and performance.
- Business Intelligence Developer Key responsibilities involve primarily designing, developing, and maintaining business intelligence systems.
- Tableau Consultant Enable firms to execute Tableau solutions, training them and providing the necessary organizational support.
- Business Analyst: Analyze the business with Tableau to assist in the improvement of processes and involve yourself in strategic business planning.
- Data Scientist: Utilizes data exploration, visualization, and insight communications in various data science applications.
- Tableau Architect: Oversight of organization-wide implementation, including the design and architecture
- Tableau Certification not only enhances career opportunities and boosts your career with specialized skills, aligning with the Tableau Desktop Specialist Certification, but it also provides exposure to key concepts, including statistics, data mapping, and establishing data frameworks.
Salary of a Tableau Developer in India
The salary offered is higher in comparison to other job profiles. Tableau developers’ salaries in India seem to be increasing, as seasoned developers are earning upwards of 20 lakhs per annum. Moreover, in India, someone with 1 to 2 years of experience makes 8 lakhs per annum.
Furthermore, if you learn Tableau, there is plenty of opportunities for advancement. However, this varies depending on some factors, such as area, level of expertise, and skill sets. Tableau developers have diverse career paths to pick from, like computer architect, business intelligence developer, business objects developer, data analyst, and many more.
Your career paths as a certified Tableau professional from a well-respected institute are limitless. Unlike some other programming languages that are quite restrictive, this language provides amazing prospects and a wealth of opportunities.
Henry Harvin Tableau Course: Become an Expert in Tableau

Certification for this interface highlights your knowledge of advanced Tableau tools and showcases your Tableau expertise to employers or clients, which helps significantly elevate your professional journey.
Many prominent institutions offer Tableau Training Courses, both online and offline. Henry Harvin supersedes all in providing various courses and certifications online, and Tableau is one of their most popular and sought-after certifications.
Henry Harvin is an international educational technology firm that offers training and consulting services, featuring an extensive array of upskilling and reskilling initiatives. It has earned the title of a “Great Place to Work” and is listed among the top 500 ed-tech companies worldwide and within the top 100 in India, as per Internshala. The organization provides a variety of programs, such as certification, diploma, degree, and doctorate courses, all aimed at fostering career advancement and skill enhancement.
Henry Harvin has a worldwide presence, providing an extensive range of more than 1200 courses spanning over 37 categories, encompassing public, college, and corporate training programs.
Furthermore, Henry Harvin offers India’s top Tableau online course, designed according to competency benchmarks established by NASSCOM in partnership with the industry and sanctioned by the government. This not only lets you develop engaging data visualizations utilizing the leading tools in the field, but also gets you ready for the Certified Data Visualization Course, which equips you for the Tableau Desktop Certified Associate designation.
Tableau Course Details
Main Tableau course highlights offered at Henry Harvin :
- Instructor-led training (online), followed by twenty-four hours of masterclass sessions and 50 hours of e-learning access.
- Seasoned and expert faculty with decades plus experience and expertise within the industry
- Live online projects for training as per industry standards to upgrade your skillset.
- Join Henry Harvin’s global alumni network
- Gold Membership benefits of Henry Harvin’s school of data science and analytics, and avail exclusive benefits.
- Access to online E-learning with 52 plus masterclass sessions for the development of essential soft skills.
- Receive weekly personalised job notifications for Tableau online.
- Get support for interviews with top corporate houses.
- Receive Tableau Desktop Qualified Associate Certification post-examinations.
- Receive proficiency certifications in the various Tableau tools and other latest software.
Benefits of Tableau Certification / become a Tableau Data Analyst
- Enables you to utilize Tableau’s tools efficiently, thereby enhancing your productivity.
- If you work as a data analyst or IT pro, this badge adds weight to your resume.
- Companies trust Tableau for charts that turn numbers into stories people understand.
- The best part is that the learning is structured, and skills are chosen as per interest and requirements.
- Fetches high salary packages and boosts the resume in addition.
- Encourages analytical thinking and storytelling using data.
Become a Tableau Certified Data Analyst.
A Tableau Data Analyst helps investors and associates make business decisions by understanding the business problem, identifying data to explore for analysis, and delivering actionable insights.
Conclusion
Tableau has become a top-rated data visualization platform and is widely preferred by industries like e-commerce, IT, fashion, and education to visually and effectively present their ideas and products through visualizations and dashboards. Tableau analytics tools provide unparalleled speed, power, and clarity. It is one of the most trending job skills in today’s job market. Data-driven IT often requires talent with expertise in Tableau skills. To summarize, this interface makes it easier for anyone, regardless of their level—beginner or professional—to harness and act decisively, backed by the data’s insightful stories.
Recommended Reads:
- The Future of Data Science: Opportunities and Challenges
- How to Start Your Journey in Data Science: Tips for Beginners
- How a Data Science Course Can Transform Your Career in UAE?
- Top 12 Tableau Courses Online
- Top 25 Tableau Interview Questions and Answers in 2024
FAQs
Ans. – Students and people seeking career shifts into data or other business roles
1. Entrepreneurs & Freelancers who want to analyze business performance
2. Business Analysts & Managers who need to interpret and present data
3. IT Developers & Engineers who wish to work with data visualization
Ans. – The most sought-after tool with high salary packaging and has high demand + good pay,
No requirement for coding, best visuals, interactive, and valuable across industries.
Ans. This Certification is apt for professionals who wish to enhance their expertise through data analysis. This certification accentuates one’s ability to accomplish technical tasks.
Ans. Although certification for Desktop Specialist is for a lifetime, however, Data Analyst & Server Associate certifications have 2-year validity.
Ans. Indeed. This skillset is in high demand across industries. As a matter of fact, Tableau-certified professionals are required in the IT industry at large in roles like Data Analyst, Product Analyst, developer, visualization creator, etc.